Chart Analysis - Support and Resistance
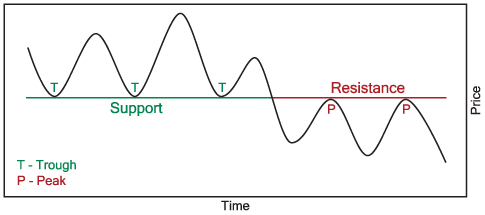
Support is the price level where “greedy” buyers enter the market to prevent prices from declining further. Support can develop at a specific price or, more commonly, in a price zone. Areas of support can exist for many months at a time.
After breaking support, traders who bought in the zone of support are now holding losses and, in order to break even, want to sell as soon as prices approach their original purchase prices
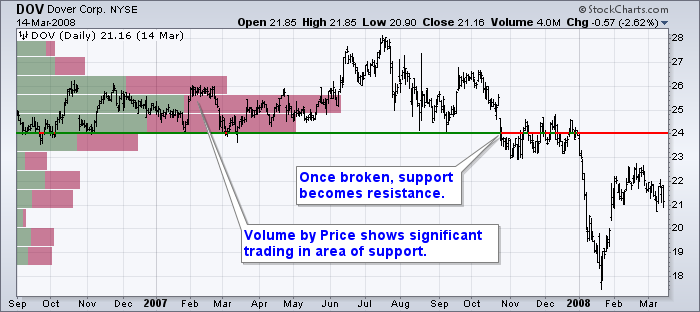
The Volume by Price overlay (volume traded in incremental price ranges) in the following SharpChart of Dover Corp. illustrates how strong support at 24 later became significant resistance as greed turned into fear.
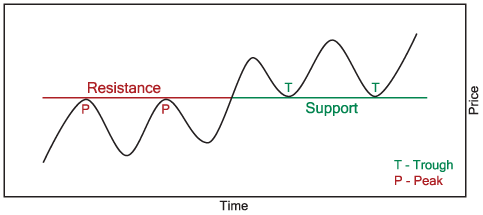
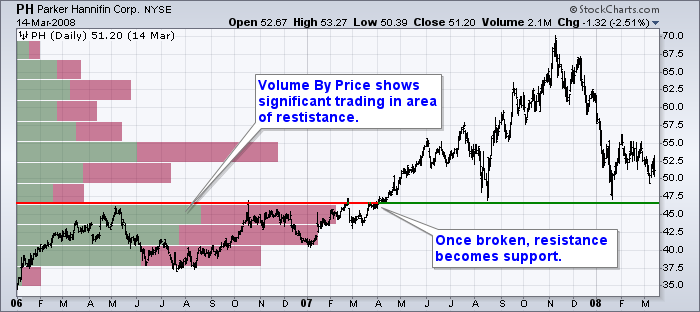
If resistance is broken, market psychology causes the previous area of price resistance to turn into support. The diagram above illustrates this market behavior. Stock holders who sold in the zone of resistance are now regretting selling and want to buy as soon as prices approach the level they sold at earlier. Prices that seemed too high before now look like a bargain. The following SharpChart of Parker Hannifin Corp. illustrates resistance later becoming support. Notice how Volume by Price indicates the potential number of previous sellers willing to buy again if given the opportunity.
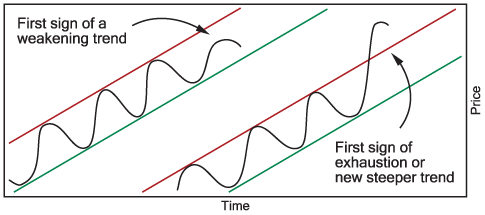
Trend Psychology
Price Channels


Comments
Post a Comment